Network Details
The Network details page offers a view of the highest level in the hierarchy of your equipment.
Network / Node / Card / OLT / Port / ONU
Navigation
To access this view, from the left navigation bar select the  (Operate) button. This is the home page for the Operate tool. To return to this page while looking at equipment details, click the View Network button above the tree view of equipment.
The resulting page consists of the following tabs:
-
Insights: Displays alerts (insights) associated with the top level of the hardware hierarchy of your network infrastructure.
-
Network Map: Shows the geographic locations of the node hardware sites associated with your network. Collapsed by default.
-
Insight Summary Dashboard: Displays insight count per node and per insight types.
-
Access Network Dashboard: Provides a comprehensive overview of access network health and capacity metrics.
The content of these tabs is described in detail in the following sections.
Insights
The Insights tab displays a list of alerts across all network hardware. Found above this list are the "Top 5 Nodes by Insight Count" and "Top 5 Categories by Insight Count" charts.
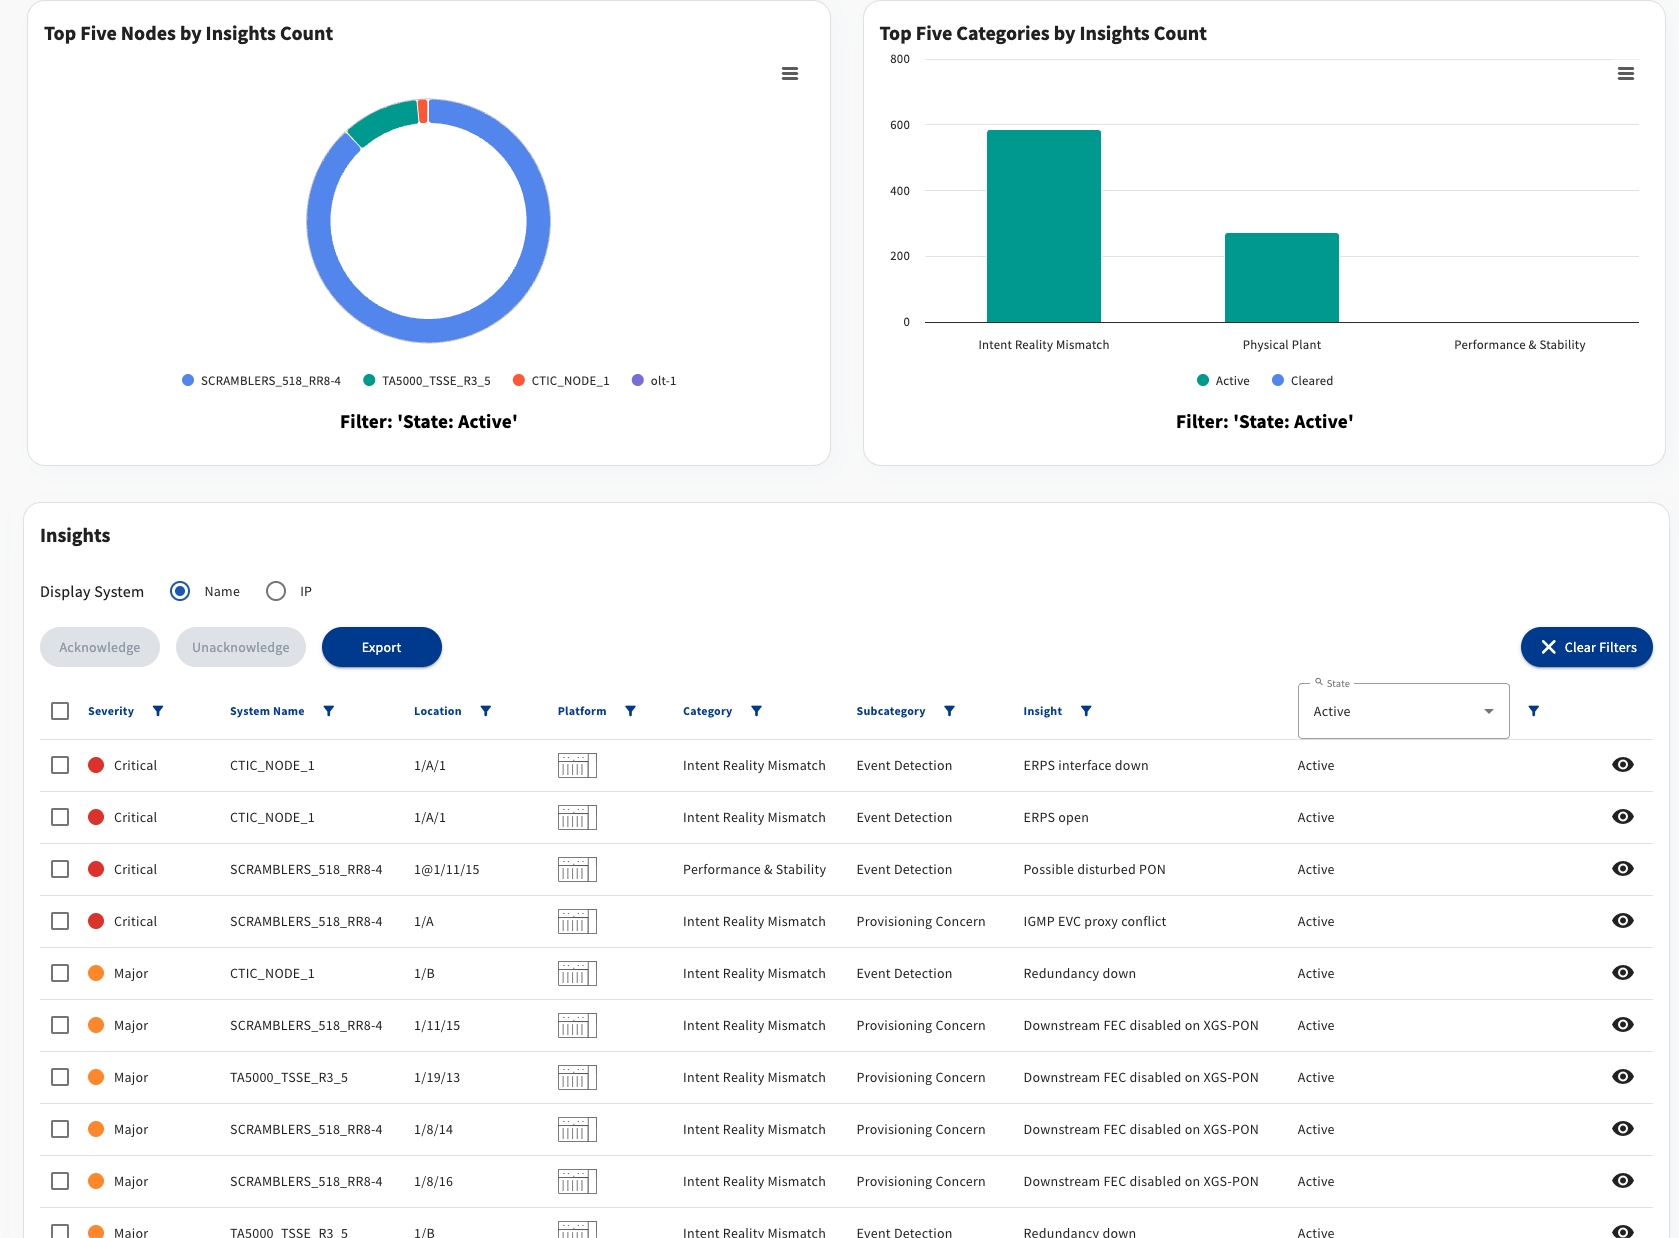
Filters of your choosing can be applied by leveraging the various search fields placed just above the column headers. These search filters may be used individually or in combination to specialize the display to meet your needs.
Access the search field by selecting the adjacent  button, then enter the search criteria in the text field that appears.
Top 5 Nodes by Insight Count Chart
Displays the top 5 nodes for the insights table based on the current filter for the table. It's contents will change based on the filter selected in the insights table. Clicking on a segment of the donut chart will filter the contents of the table to the node's 'System Name'. Clicking anywhere on the chart will clear the node filter in the table below.
Top 5 Categories by Insight Count Chart
Displays the top 5 categories for the insights table based on the current filter for the table. This bar chart has the active and cleared counts stacked for each of these top 5 categories. It's contents will change based on the filter selected in the insights table. Clicking on a bar will filter the contents of the table by the clicked insight category. Clicking anywhere on the chart will clear the category filter in the table below.
Insights - Table Columns Defined
Each column of the table of insights displayed on screen is described below.
Severity
A rating of the severity of the alert rated on a scale of 0-5. The significance of each rating is:
- Severity 5: Critical
- Severity 4: Major
- Severity 3: Minor
- Severity 3: Minor
- Severity 2: Alert
- Severity 1: Informational
System Name
Top-level name of the network device.
Location
The identifier of the network location associated with the insight. Exact format of the field will vary depending on the source location.
For example
- Shelf/slot/port
- Slot/port
- RemoteID@Shelf/slot/port
Platform
Hover over the displayed platform icon to view the platform's family and type. The icon will vary depending on the platform type.
For example
- Platform Family: Total Access; Platform Type: TA5000
- Platform Family: SDX; Platform Type: SDX 6320-16
- Platform Family: Calix; Platform Type: Calix E7-Series
Category
A category of network insights that enables filtering of insight groups based on the same classification.
For example
- Intent Reality Mismatch
- Physical Plant
Subcategory
A subcategory of network insights that provides a detailed classification of insights within a specific category.
For example
- Intent Reality Mismatch > Provisioning Concern
- Physical Plant > Connection Issue
Insight
A short description of the nature of the alert detected for this row.
See the Operate Detail Views - Insights Glossary for a list of all insight names and detailed descriptions for each.
State
Insights presented are in one of three states: Active, Cleared, or Acknowledged.
- Active: An active insight is one that has been detected in the most recent scan.
- Cleared: Insights shown as cleared were not detected by the most recent scan. The system retains cleared insights for 30 days before automatically removing them from the display.
- Acknowledged: An acknowledged insight is one that has been manually acknowledged by selecting the insight and selecting the Acknowledge option.
Insight Details Icon
 Select this icon to reveal the Insight Details dialog. All key facts regarding this insight are displayed in an easy to read layout that includes a suggestion as to how the alert might be resolved.
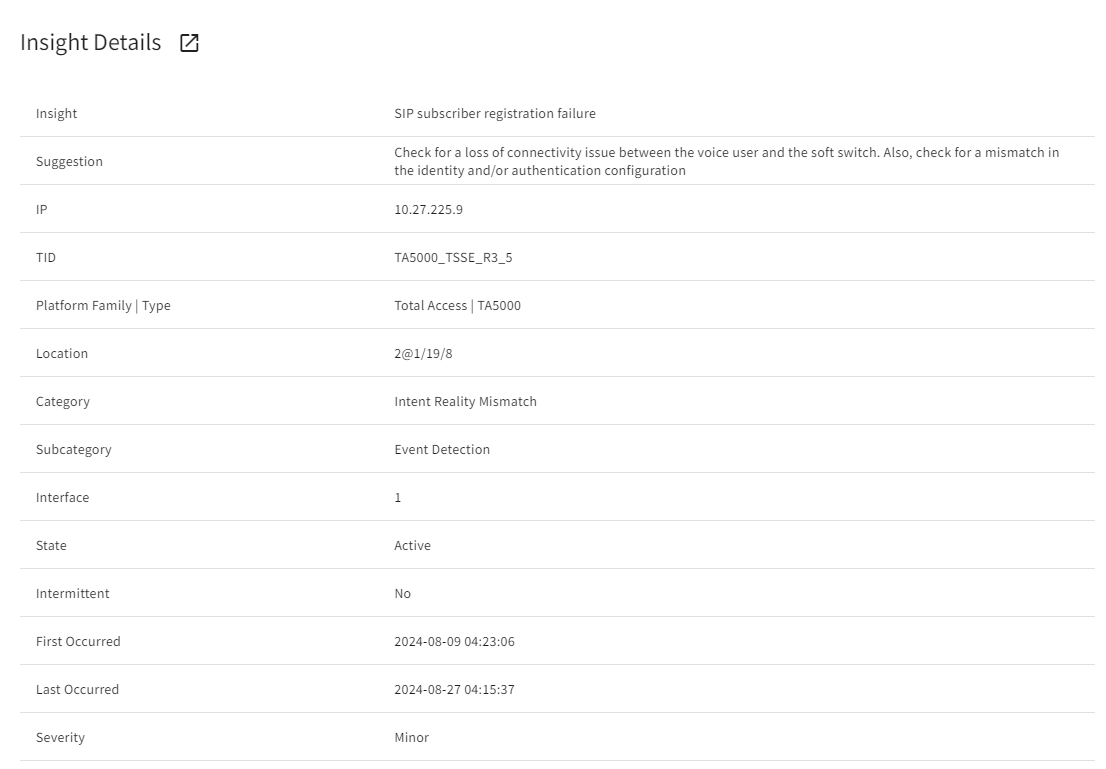
Select the  icon at the top of Insight Details to navigate to the device associated with this insight.
An intermittent insight is an insight that has previously been cleared, but has reoccurred.
Since MSI allows users to edit the field, the MSI TID could be different than the Operate TID.
Acknowledge / Unacknowledge Buttons
The  button is located just beneath the radio button selector for TID/IP near the top of the Insights panel.
To use this feature, choose one or more insight(s) and then select the button to change all selected insights to the Acknowledged state.
The  button is located to the right of the Acknowledge button.
To use this feature, choose one or more insight(s) and then select the button to remove the Acknowledged state. This will set insights back to their default state where they display either Active or Cleared.
Both Active and Cleared insights may be in the Acknowledged state. If an Acknowledged and Cleared insight becomes Active again (intermittent), the Acknowledged state will only reset and show as Active if the severity increases.
Export Button
The  button is located just beneath the radio button selector for TID/IP near the top of the Insights panel.
Use this feature to export this current snapshot of insights to your local drive in CSV format. The exported data can be useful for purposes such as:
-
Sorting the list and delegating portions of it to task various personnel with resolving the alerts.
-
Using it as an offline scratchpad to make notes about your pursuit of the resolution for each alert.
The on-screen display is limited to the first 4mb of Insights data. When this cap is exceeded, a notification will appear with a reminder that this Export feature can be used to get the complete list of insights in CSV format.
Access Network Dashboard
The Access Network Dashboard tab provides a comprehensive overview of the access and aggregation network. It features interactive widgets that visualize key health and capacity metrics, derived from data collected across all deployed network devices.
Uplink Capcity
This section presents a consolidated overview of uplink utilization of all network nodes within the access network. It illustrates how upstream and downstream bandwidth usage, as reported by active uplink interfaces, is distributed across four criticality levels.
Capacity metrics are calculated as average utilization reported by uplink interfaces in 24-hour time slots.
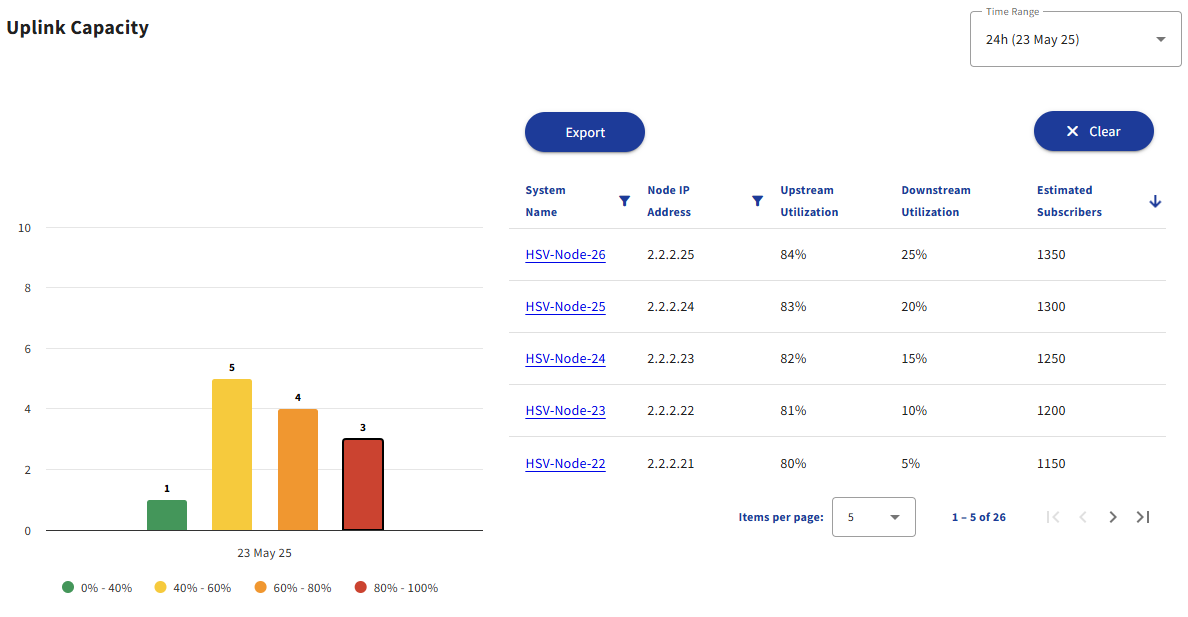
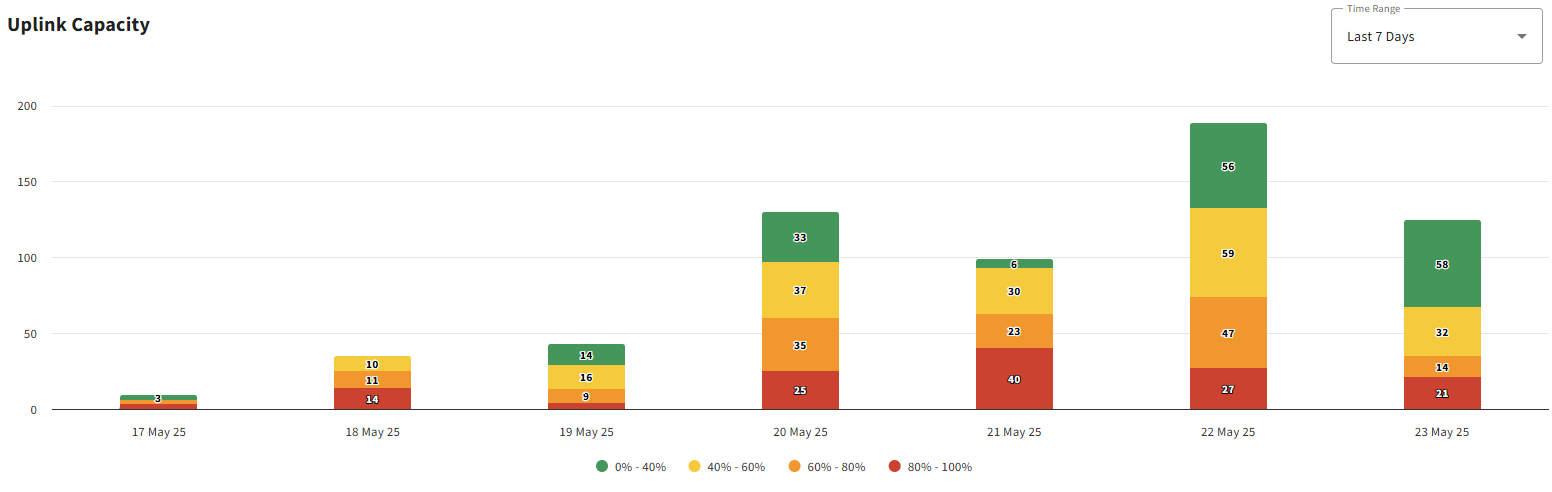
The widget includes:
- A bar chart displaying the distribution of uplink utilization levels.
- A data table listing network nodes categorized by utilization level.
Users can view data for 24 hours based on the most recent network scan, as well as historical trends over the past 7 days and 30 days.
Criticality Levels Chart
The bar chart widget aggregates uplink bandwidth utilization (both upstream and downstream) and displays its distribution across four criticality levels:
- Critical: Utilization exceeds 80%
- Major: Utilization between 60% and 80%
- Alert: Utilization between 40% and 60%
- Informational: Utilization below 40%
Users can hover over each bar to view the number of nodes within that utilization range for a specific day. Clicking a bar updates the table to show detailed information about the corresponding nodes.
Node Details Table
The table widget lists OLTs along with detailed uplink interface utilization metrics for nodes within the selected criticality level. It also includes the estimated number of subscribers connected to a node to help assess potential impact.
| Column name | Description |
|---|---|
| System Name | The name of a node reporting uplink utilization data |
| Node IP Address | The IP address of the node |
| Upstream Utilization | Percentage of upstream bandwidth used on the active uplink interface |
| Downstream Utilization | Percentage of downstream bandwidth used on the active uplink interface |
| Estimated Subscribers | Estimated number of subscribers connected to the node |
By default, the table is sorted in descending order by the number of estimated subscribers. Users can sort by any numerical column and filter by OLT node attributes.
Tabular data can be exported to PDF or CSV formats by clicking the Download button.
PON Capcity
This section presents a consolidated overview of PON utilization of all PON interfaces deployed within the access network. It illustrates how upstream and downstream bandwidth usage, as reported by active PON ports, is distributed across four criticality levels.
Capacity metrics are calculated as average utilization reported by PON interfaces in 24-hour time slots.
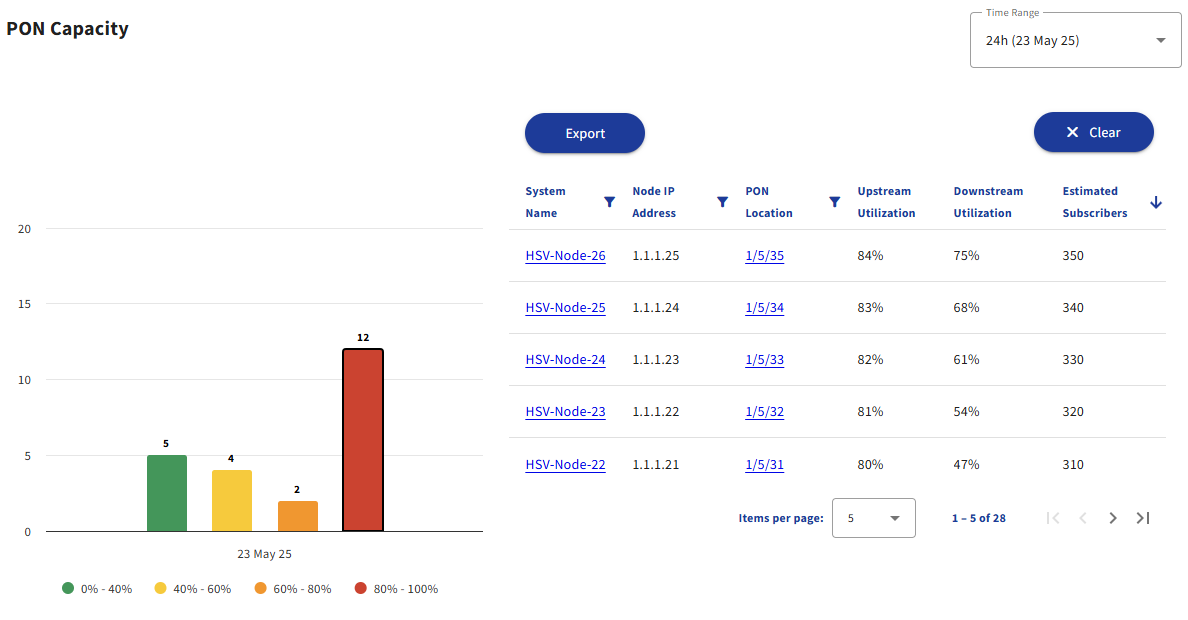
The widget includes:
- A bar chart displaying the distribution of PON utilization levels.
- A data table listing PON ports categorized by utilization level.
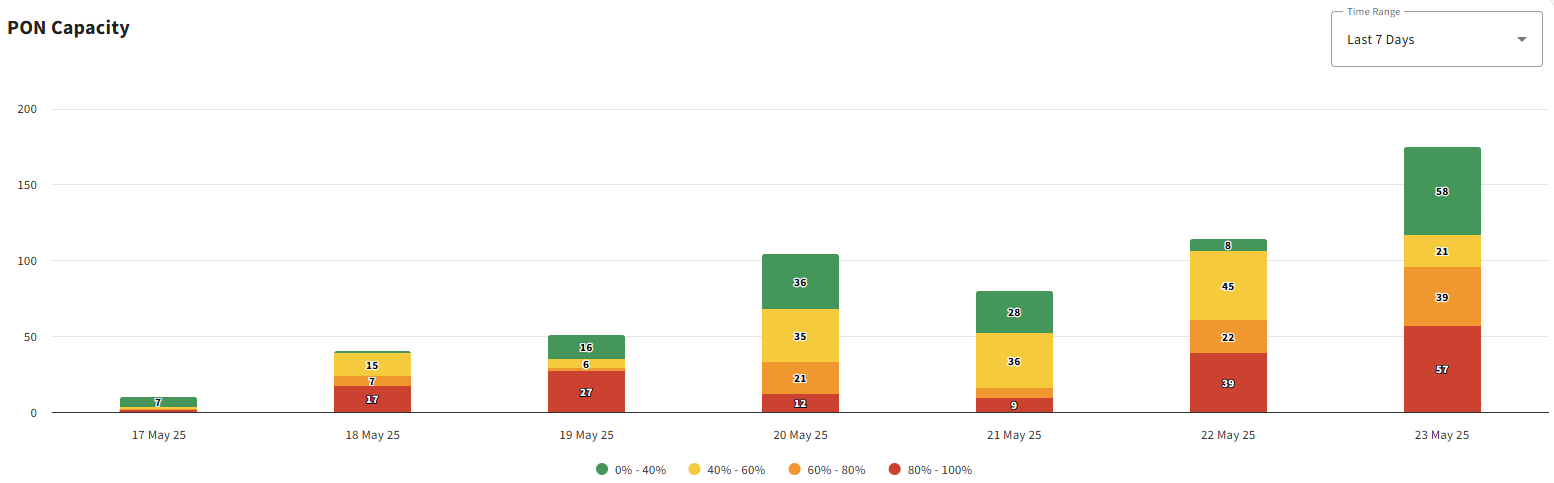
Users can view data for 24 hours based on the most recent network scan, as well as historical trends over the past 7 days and 30 days.
Criticality Levels Chart
The bar chart widget aggregates PON bandwidth utilization (both upstream and downstream) and displays its distribution across four criticality levels:
- Critical: Utilization exceeds 80%
- Major: Utilization between 60% and 80%
- Alert: Utilization between 40% and 60%
- Informational: Utilization below 40%
Users can hover over each bar to view the number of PONs within that utilization range for a specific day. Clicking a bar updates the table to show detailed information about the corresponding PONs.
PON Details Table
The table widget lists OLTs along with detailed PON utilization metrics for ports within the selected criticality level. It also includes the estimated number of subscribers connected to a PON to help assess potential impact.
| Column name | Description |
|---|---|
| System Name | The name of a parent node for a PON interface reporting utilization data |
| Node IP Address | The IP address of the node |
| PON location | The physical PON location in a network device hierarchy |
| Upstream Utilization | Percentage of upstream bandwidth used on the active PON interface |
| Downstream Utilization | Percentage of downstream bandwidth used on the active PON interface |
| Estimated Subscribers | Estimated number of subscribers connected to the PON |
By default, the table is sorted in descending order by the number of estimated subscribers. Users can sort by any numerical column and filter by OLT and PON attributes.
Tabular data can be exported to PDF or CSV formats by clicking the Download button.
Network Map
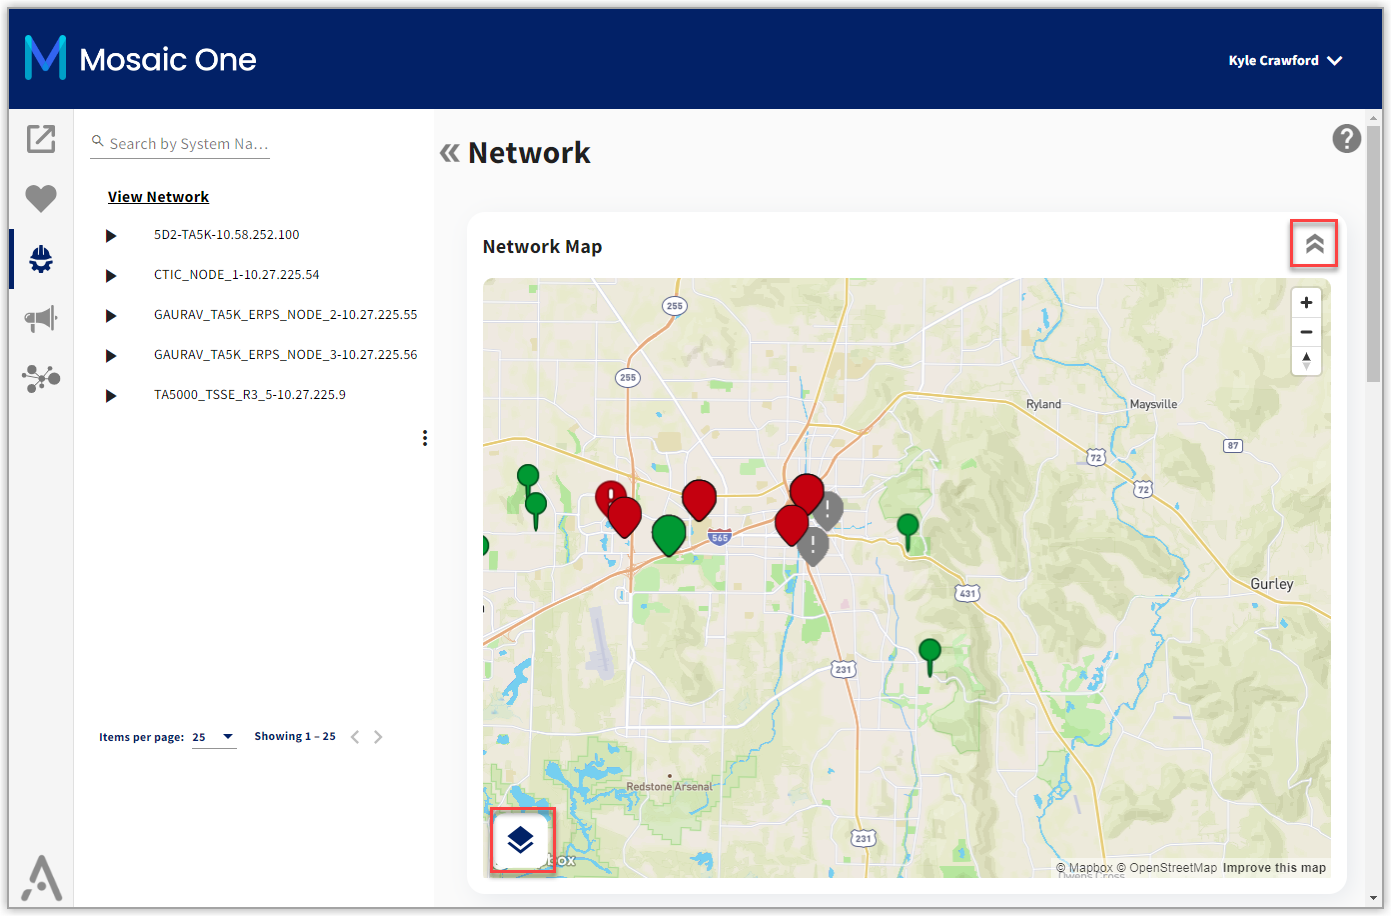
The Network Map reveals the geographic locations of hardware associated with your network. This map is collapsed upon opening the Operate tool, but can be expanded by selecting the drop-down arrow on the right side of the screen. Additional filters and search options can be found by selecting the box at the bottom-left of the map. Maximize your browser window width for the best map navigation and viewing experience.
Map Navigation
Use the following controls to move about the map and alter the map display
Control Function
Pan Click and drag anywhere on the map to pan about the local vicinity.
Zoom in Select the + button in the upper-right corner to zoom in for greater map detail.
Zoom out Select the - button in the upper-right corner to zoom out and view a larger geographical area.
Alternate zoom (mouse) Map zoom can also be controlled by the mouse scroll-wheel (or equivalent trackpad gesture).
Change map perspective Depress mouse-right button in combination with forward-back mouse movement to vary the map display perspective from the default 2-D (birds eye view) to 3-D (display the map in three dimensions).
Rotate map Depress mouse-right button in combination with left-right mouse movement to rotate the map image clockwise and counter-clockwise.
View Site Data
Reveal details about a location by selecting a pin on the map.
-
The Site Details for the selected site appear at the side of the screen in a shaded box.
-
The details shown vary based on the type of site and are detailed below.
-
The pins on the map are color coded according to the severity of alarm condition(s) that presently apply to that location.
-
The legend/meaning of the map pin colors varies based on the type of site and are detailed below.
ONT/ONU Hardware - Site Details and Color Legend
ONT/ONU hardware is represented by the  symbol.
The legend for the map pin colors for this type of site is as follows:
Map Pin Color Meaning
Green No significant alarm condition is present for this node. An Active Alarm Severity rating of unknown, none, or info is applied.
Yellow Minor alarm conditions are present on this node. An Active Alarm Severity rating of alert, warning, or minor is applied.
Red Critical alarm conditions are present on this node. An Active Alarm Severity rating of major critical is applied.
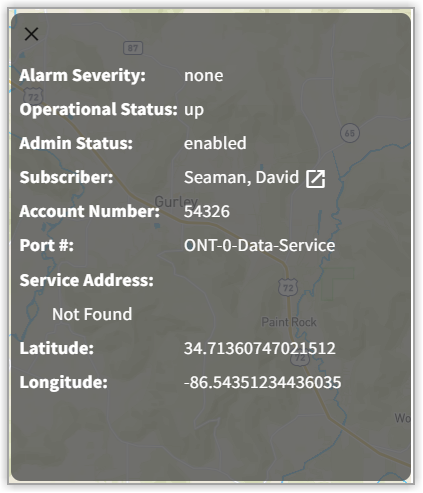
Site detail information for each marker is available by selecting the marker with your mouse. ONT sweep data will refresh every 30 seconds when the marker is selected. The site detail information for ONU/ONT hardware located at subscriber sites includes the following fields:
Field Name Definition
Alarm Severity Shows the severity of the alarm condition for the selected network hardware. The severity states include:
- unknown
- none
- info
- alert
- warning
- minor
- major
- critical
Operational Status Shows the operational state of the selected network hardware. The operational states displayed include:
- up
- down
Admin Status Shows the administrative status of the selected network hardware. The admin states displayed include:
- enabled
- disabled
Subscriber Shows the name of the subscriber. Name doubles as a link to the subscriber's Care page.
Account Number A customer number or other unique identifier associated with this subscriber.
Port # The port number associated to the UNU/ONT.
Service Address The address that the subscriber receives service.
Latitude / Longitude Geographic coordinates of the network as shown on the Network Map.
Non ONT/ONU Hardware - Site Details and Color Legend
Node/Site hardware is represented by the  symbol.
The legend for these colors is different from that of customer premises hardware (described above) and is as follows:
Map Pin Color Meaning
Green No significant alarm condition is present for this node. An Active Alarm Severity rating of OK is applied.
Yellow Minor alarm conditions are present on this node. An Active Alarm Severity rating of Warning is applied.
Orange Major alarm conditions are present on this node. An Active Alarm Severity rating of Major is applied.
Red Critical alarm conditions are present on this node. An Active Alarm Severity rating of Severe is applied.
Grey Nodes will be shown as Disabled if they have defined geographic coordinates, but are not configured to be scanned.
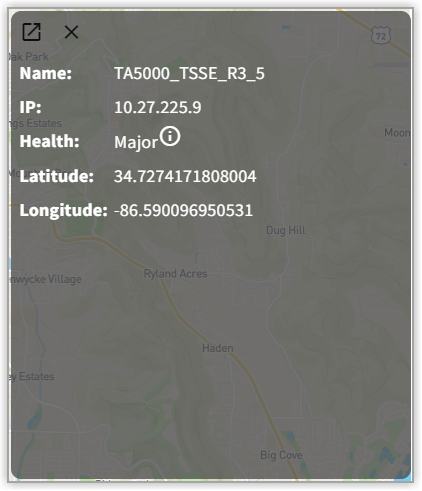
Site detail information for each marker is available by selecting the marker with your mouse. The site detail information for non CPE hardware includes the following fields:
Field Name Definition
 Select this icon to link to the Node page associated with this equipment.
This icon appears in the upper left corner of the site detail box when IP address data is present for the selected network equipment.
- This link will not be visible for sites bearing no IP address data.
Name The name given the chassis at the selected location.
IP The IP address associated with the chassis at the selected location.
Health A numerical value between 1 and 5 indicating alarm severity (if applicable) for the network hardware at this location. Refer to the color legend and corresponding health rating described in the table immediately above.
Latitude / Longitude Geographic coordinates of the network as shown on the Network Map.
Insight Summary Dashboard
The Insight Summary Dashboard tab displays the "Top 5 Nodes by Insight Count" and "Top 5 Insight Types" charts. Below each chart is a corresponding table containing the corresponding nodes and insight types.
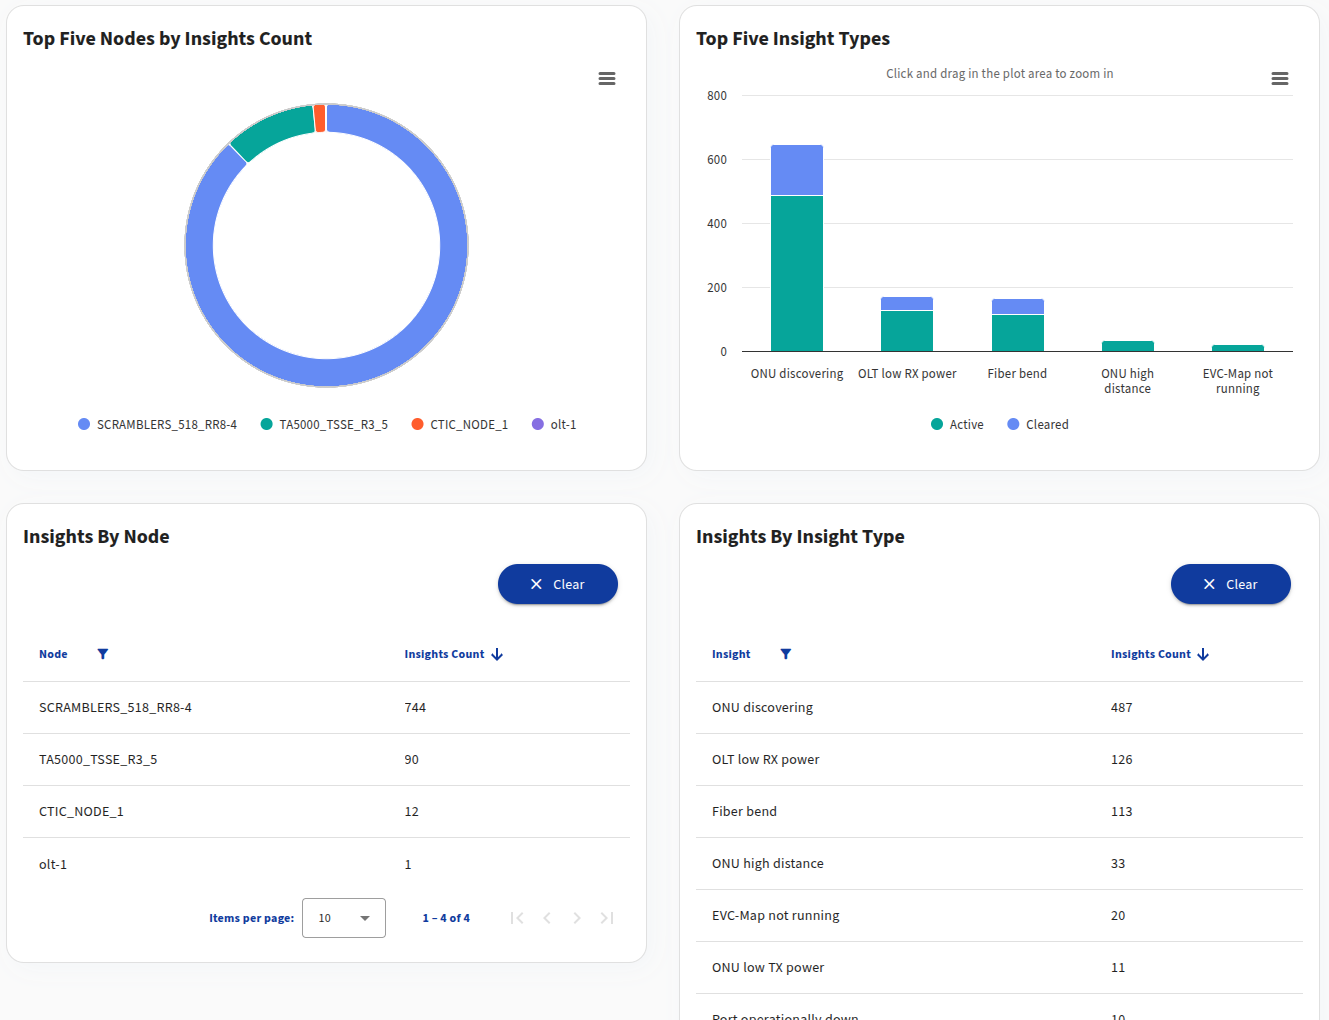
Top 5 Nodes by Insight Count Chart
Displays the top 5 nodes based on active insight count. Its contents will change based on the filter selected in the table below. Clicking on a segment of the donut chart will filter the contents of the table to the node's 'System Name'. Clicking anywhere on the chart will clear the node filter in the table below.
Top 5 Insight Types Chart
Displays the top 5 insight types based on active insight count. This bar chart has the active and cleared counts stacked for each of these top 5 insight types. Its contents will change based on the filter selected in the table below. Clicking on a bar will filter the contents of the table by the clicked insight type. Clicking anywhere on the chart will clear the insight type filter in the table below.
Insights By Node
Displays each node and its corresponding active insight count. By default, this table is sorted in descending order of the active insight count. The table can be filtered by a given node's system name. Its contents will also change based on if a series has been selected in the donut chart above.
Insights By Insight Type
Displays each insight type and its corresponding active insight count. By default, this table is sorted in descending order of the active insight count. The table can be filtered by a given insight type. Its contents will also change based on if a series has been selected in the bar chart above.