Care Subscriber Details
The Care Subscriber Details page offers a view of key subscriber-centric information. This includes billing system information, customer equipment status, and bandwidth usage. Also included are network insights associated with the specific hardware carrying service to the selected subscriber and subscriber experience data points. These and more are explained in detail in the following sections.
From the page, another search can be executed if needed. Select the Subscriber Search field then enter the search criteria followed by the Enter key or select the  icon to execute the search.
Available Subscriber Data
The Care Subscriber Details page consists of the following five areas:
-
Contact information (such as name, address, ID, etc.) for the selected subscriber (upper left)
-
Subscriber Experience displays a summary tab, as well as one tab for each circuit/router/home (upper middle)
-
Top Insights associated with the network hardware that directly services the selected subscriber (middle)
-
Charts and Graphs time series charts (bottom)
-
Application Links associated with the selected subscriber (bottom left)
The content of all five areas is described in detail in the following sections.
Contact Information
The first area in the upper left displays the subscriber's contact information, including the subscriber name, street address, account number, and more. This area also includes an experience rating indicating the overall health of the subscriber. Issues appearing in the Active Issues Table will cause this rating to go from Good to Fair or Poor, depending on severity. In general, Fair means the subscriber still has service, but could be experiencing issues that degrade that service. Poor means the subscriber may or may not have service, and will require assistance to fix the issue.
A pin icon is displayed next to the subscriber name. Clicking on this icon will add a subscriber to the Pinned Subscribers table which can be accessed from the Care Search page. Likewise, clicking on this icon again will remove the subscriber from the Pinned Subscribers table.
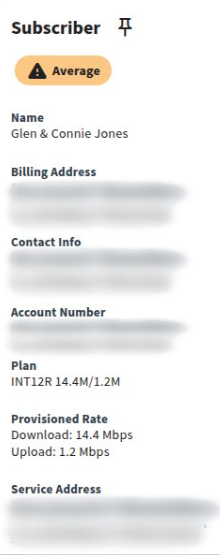
| Field Name | Description |
|---|---|
| Name | Subscriber first and last name. |
| Billing Address | Address associated with account billing. |
| Contact Info | Contact information such as phone number and email address. |
| Account Number | Subscriber Account Number as entered by the provider in the Mosaic Subscriber Insights application. |
| Plan | The billing speed package associated with this subscriber. |
| Provisioned Rate | The provisioned rate of the subscriber's service. |
| Service Address | Physical street address where the subscriber is receiving service. When there are multiple services, this field becomes a drop-down menu with each service address as an option. |
Subscriber Experience
The second area in the upper middle of the Care Subscriber Details page is a multipurpose display and is divided into four tabs for each section (Subscriber Experience, Circuit, Device, and Home). Selecting each tab will re-purpose the display to show information related to the tab label. These four tabs are described in detail below.
Subscriber Experience Tab
Network Topology

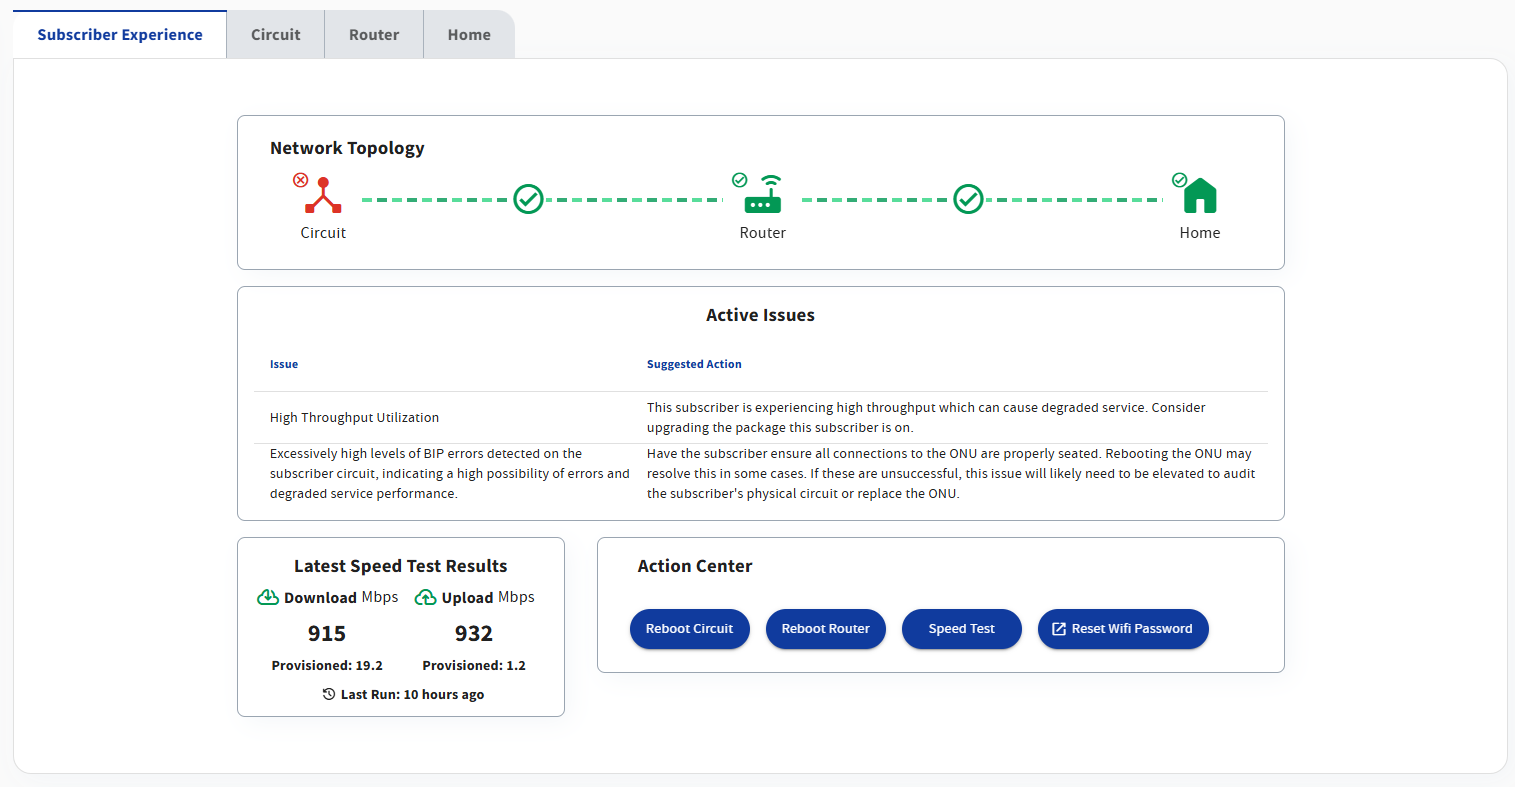
This area provides a view of all status related information for a subscriber in a pictoral view. Generally, this view is meant to quickly highlight issues with a subscriber's service. Hovering over each icon will give more information, and full details can be seen in the respective Circuit, Router, and Home tabs. Note: The Router and Home icons require the subscriber be present in either Intellifi, Plume, or Device Manager. More details are described in the table below.
| Topology Icon | Contributing Factors | Notes |
|---|---|---|
| Circuit |
| Requires the service to exist in Mosaic Subscriber Insight. |
| Circuit/Router Link |
| Requires BSS records to be accurate, especially in cases where the primary ethernet port is not port 1 of the ONU. |
| Router |
| Requires Intellifi, Plume, or Device Manager. |
| Router/Home Link |
| Requires Intellifi or Plume and mesh nodes to be present. |
| Home |
| Requires Intellifi, Plume, or Device Manager. |
Active Issues Table
The Active Issues Table presents a list of potentially service affecting issues to supplement the Network Topology view above. Other data sources such as access network insights coming from Operate and historic data traffic patterns will generate these issues. Each issue has a suggested action for remedy to help in troubleshooting. Each issue also has an associated experience rating which affects the rating shown in the Contact Information area. The following table displays the list of currently supported issues.
| Active Issue | Description | Experience Rating |
|---|---|---|
| Admin State Down | Learned from on-demand circuit data, this issue will appear when the admin state of the circuit is not up. | Poor |
| Oper State Down | Learned from on-demand circuit data, this issue will appear when the oper state of the circuit is not up. | Poor |
| ONU Recently Rebooted | Learned from on-demand circuit data, this issue will appear when the ONU in the service has been up for less than 24 hours. | Fair |
| Optical levels are lower than the specification allows. | Learned from on-demand circuit data, this issue will appear when any light level is out of spec. | Fair |
| Low levels of BIP errors detected on the subscriber circuit, indicating errors and possibly degraded service performance. | Learned from Operate, this issue will appear when a small amount of BIP errors are detected. | Fair |
| Excessively high levels of BIP errors detected on the subscriber circuit, indicating a high possibility of errors and degraded service performance. | Learned from Operate, this issue will appear when a large amount of BIP errors are detected. | Fair |
| ONU Ethernet Port Not Operational | Learned from on-demand circuit data, this issue will appear when the ethernet port state of the ONU is not up. | Poor |
| ONU Ethernet Port State Mismatch | Learned from on-demand circuit data, this issue will appear when the ethernet port state of the ONU does not match the provisioned rate. | Fair |
| Controller lost connection to Intellifi Cloud | Learned from Intellifi Meshview, this issue will appear when the residential gateway has previously been connected to Intellifi, but has since lost connection. | Poor |
| Gateway has not reported in | Learned from on-demand router data, this issue will appear when the router in the service has not checked in for more than 24 hours. | Poor |
| Recent Router Reboot | Learned from on-demand router data, this issue will appear when the router in the service has been up for less than 2 hours. | Fair |
| Mesh Node Signal Low or Disconnected | Learned from on-demand router data, this issue will appear when there are mesh nodes in the service that are either offline or have low signal. | Fair or Poor, depending on the severity of the problem. |
| Devices with low signal | Learned from on-demand home data, this issue will appear when some home devices have low signal. | Fair |
| Several devices with low signal | Learned from on-demand home data, this issue will appear when many home devices have weak signal. | Poor |
| High Throughput Utilization | Learned from sflow data, this issue will appear when the subscriber traffic is using up more than 80% of their available bandwidth for extended periods of time. | Fair |
Clarity AI Service Summary
See Clarity AI Service Summary for details.
Latest Speed Test Results
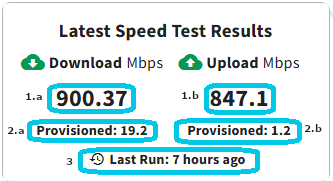
This card shows the last known download and upload speeds from a subscriber's network. Note: This information requires the subcriber be present in either Plume or Intellifi.
| # Number & Name | Description |
|---|---|
| #1.a: Latest Speed Test Download Result | Field showing the download speed result of the last run speed test for a given service, in Mbps. |
| #1.b: Latest Speed Test Upload Result | Field showing the upload speed result of the last run speed test for a given service, in Mbps. |
| #2.a: Provisioned Download Rate | Field showing the provisioned download speed of the given service in Mbps, if data is available. |
| #2.b: Provisioned Upload Rate | Field showing the provisioned upload speed of the given service in Mbps, if data is available. |
| #3: Time Since Last Test | Field showing the amount of time that has passed since the last speed test was completed. |
Action Center
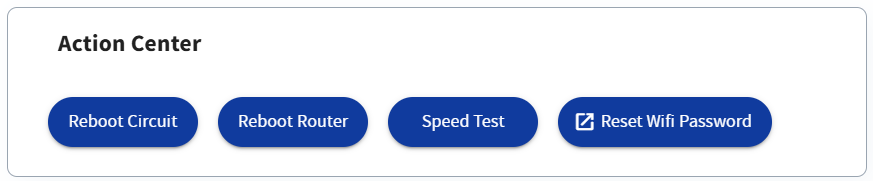
The Action Center presents key functions that can assist when troubleshooting a subscriber issue. Buttons with the square icon denote links to other applications. For example, the reset wifi password button opens a new browser tab to the appropriate place in either Plume Frontline or Intellifi MeshView. The four supported actions are Reboot Circuit, Reboot Router, Speed Test, and Reset Wifi Password (link). Below is a table with more information about each action.
| Action | Description | Supported Services |
|---|---|---|
| Reboot ONU/Circuit | For fiber circuits, reboots the subscriber's CPE. For copper, resets the port. Requires appropriate integration user permissions - contact Adtran support to enable. | Services supported by Mosaic Subscriber Insight |
| Reboot Router | Reboots the subscriber's router. | Intellifi, Plume, Device Manager |
| Speed Test | Runs a speed test leveraging Intellifi or Plume, if available. For DM services, provides a link to DM. | Intellifi, Plume, Device Manager |
| Reset Wifi Password (link) | Provides a link to the appropriate view in either Plume Frontline or Intellifi MeshView. For DM services, a top level link is provided. | Intellifi, Plume, Device Manager |
Circuit Tab
Select the Circuit tab to display the following information regarding the access network:
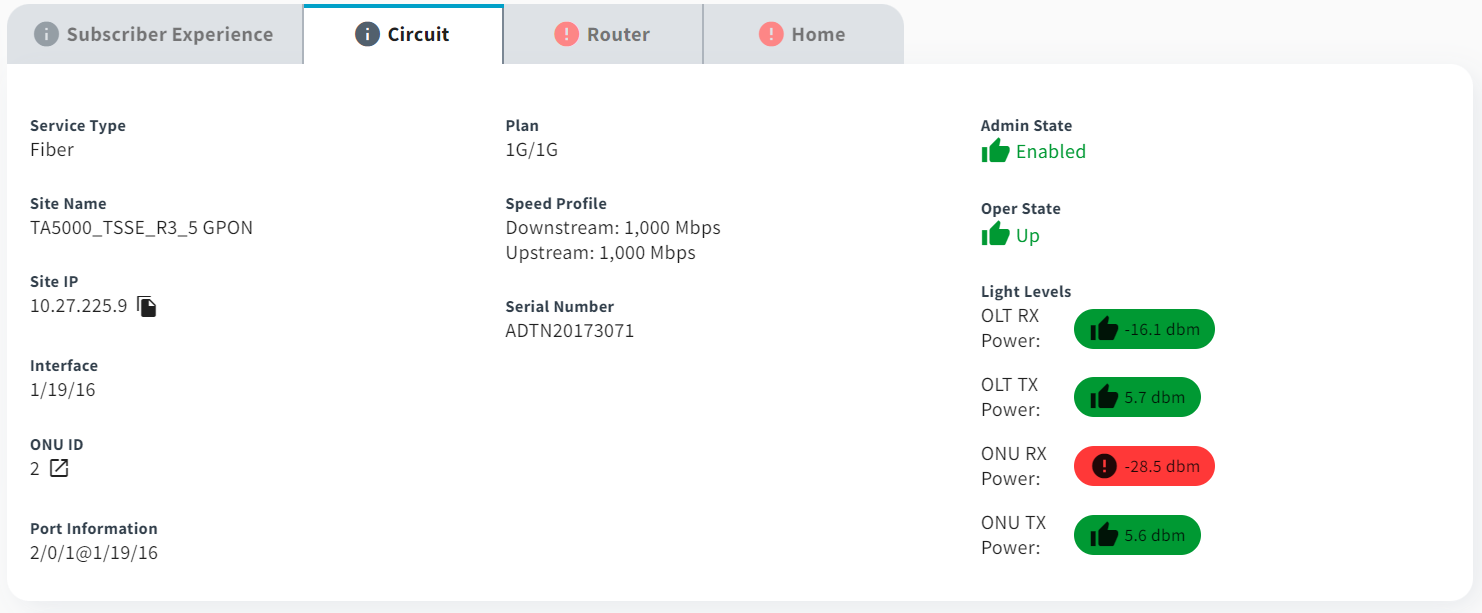
| Field Name | Description |
|---|---|
| Service Type | The type of service this subscriber is receiving. Some service types such as cable do not have much information to show. |
| Site Name | The name of the site that services this subscriber's service. |
| Site IP | The management IP address of the site. |
| Interface | The shelf/slot/port location of this subscriber. |
| ONU ID | The ONU ID associated with this subscriber. Select the  icon to view ONU details. icon to view ONU details. |
| Port Information | Similar to the interface, this field provides a full description of the port. In general, this field is most useful in SDX deployments. |
| Serial Number | The serial number of the CPE equipment. Often times, this is the ONU serial number. |
| Device Type | The type of CPE equipment. For fiber deployments, this is the ONU. |
| Admin State | Displays the administrative status of the CPE equipment. The admin state will be one of the following: In-service, Out of service, Out of service - Maintenence, Out of service - Unassigned, Unknown. |
| Oper State | Displays the operational state of the CPE equipment. The oper state will be one of the following: Up, Down, Discovering, Test, Unknown. |
| BIP Errors | Displays the number of BIPs from Operate data. |
| Light Levels | Shows the fiber optic light levels of the subscriber's circuit. Statistics include the following: OLT RX Power, OLT TX Power, ONU RX Power, ONU TX Power. |
Router Tab
Select the Router tab to display the following information regarding the subscriber's gateway device:
Most of the router information requires that the subscriber exists in an in-home management software such as Intellifi, Plume, or Device Manager.
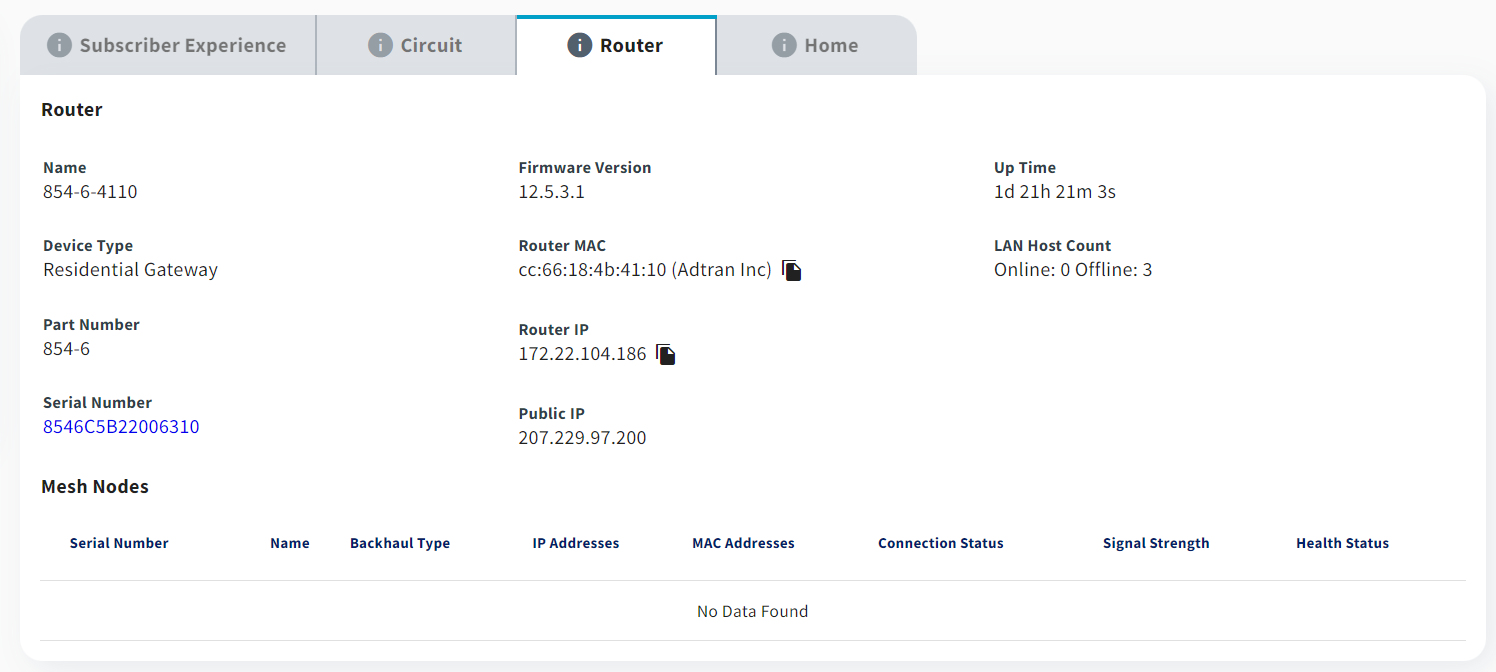
| Field Name | Description |
|---|---|
| Name | The name of the gateway device. This field is only present for Intellifi and Plume managed services. |
| Device Type | The type of device serving the subscriber's service. |
| Part Number | The part number of the device. |
| Serial Number | The serial number of the device. This field is a deep link for Intellifi and Plume managed services. |
| Firmware Version | The firmware version that is loaded on the device. |
| Router MAC | The WAN MAC of the router. |
| Router IP | The WAN IP of the router acquired through DHCP or similar processes. |
| Public IP | The public-facing IP of the router as it connects to the cloud. This is many times different from the Router IP in carrier grade NAT deployments. |
| Last Active | Shows how long ago the device made contact with the cloud. This field is only present for Device Manager managed services. |
| Up Time | Shows how long the device has been up. |
| LAN Host Count | Shows the total number of online and offline LAN hosts on the subscriber's network. |
| Mesh Nodes | The Mesh Nodes table shows similar fields as described above for each mesh device. The Signal Strength column in this table describes the uplink quality of each mesh device. |
Home Tab
Select the Home tab to display a list of all connected LAN devices. The following details are displayed for each LAN device:
Most of the home information requires that the subscriber exists in an in-home management software such as Intellifi, Plume, or Device Manager.
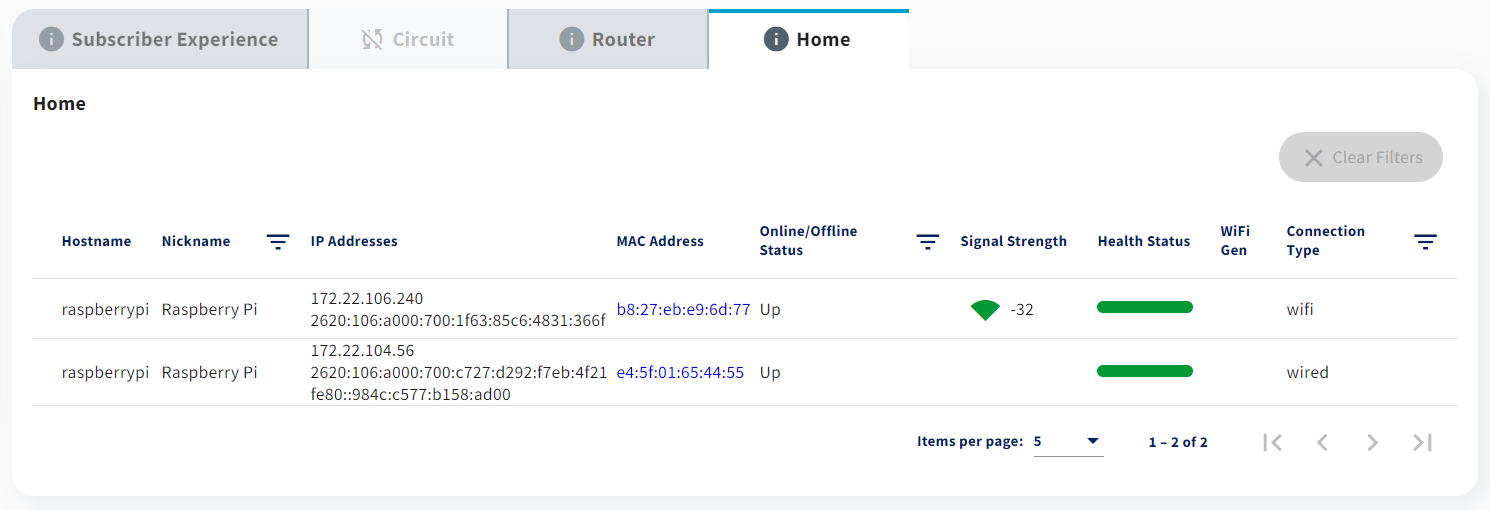
| Field Name | Description |
|---|---|
| Hostname | The name by which this LAN device is known across the network. |
| Nickname | User friendly name of the device. This field is only present for Plume managed services. |
| Online/Offline Status | Indicates whether or not the LAN device is actively communicating with the subscriber's gateway. Potenial values include Up or Down. |
| Signal Strength | Displays the WiFi Received Signal Strength Indicator (RSSI) value. This value is measured in dBm. This field is color coded to indicate quality of signal. |
| Health Status | The summarized health of the LAN device. This field is only present for Plume managed services. |
| WiFi Gen | The WiFi generation of the LAN device. This field is color coded to denote older generation wifi hosts which may result in reduced speeds. |
| Connection Type | Denotes wired vs. wireless LAN devices. |
| Connected To | The serial number or MAC address of the Mesh Node this device is connected to, if available. |
| Connection Frequency | Denotes the connection frequency of the LAN device, usually 2.4GHz or 5GHz. This field is only present for Intellifi managed services. |
Top Insights Table
The third area in the middle of the Care Subscriber Details page displays insights when they are available. For more detailed information on Top Insights, please refer to the Operate docs.
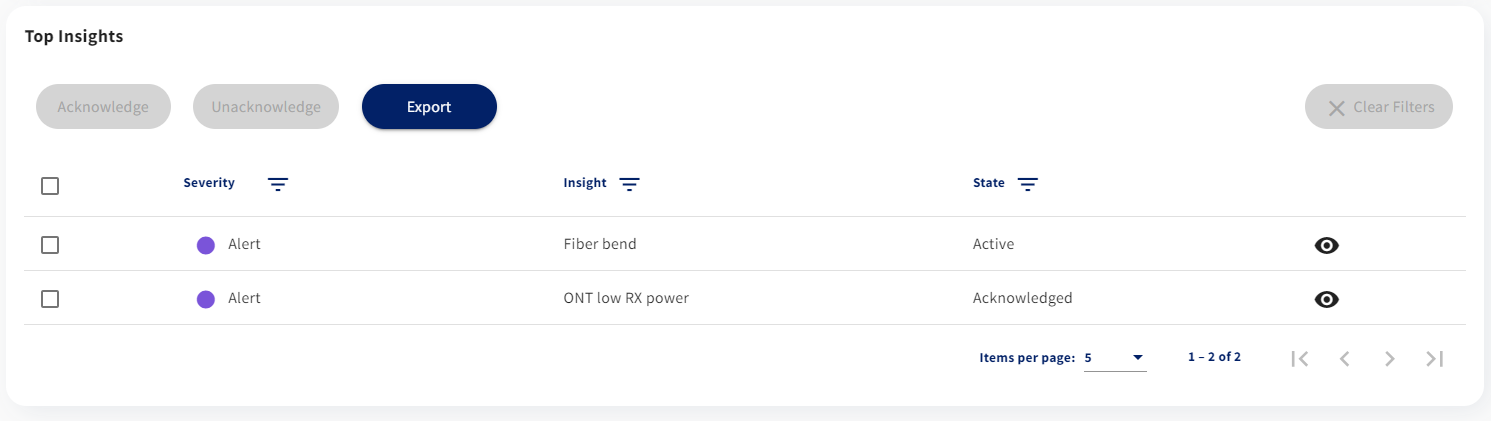
If no insight is found for a subscriber during insights scan or when the scan itself did not happen, the Top Insights tile will be replaced by the below notifications.


Charts and Graphs
Utilization
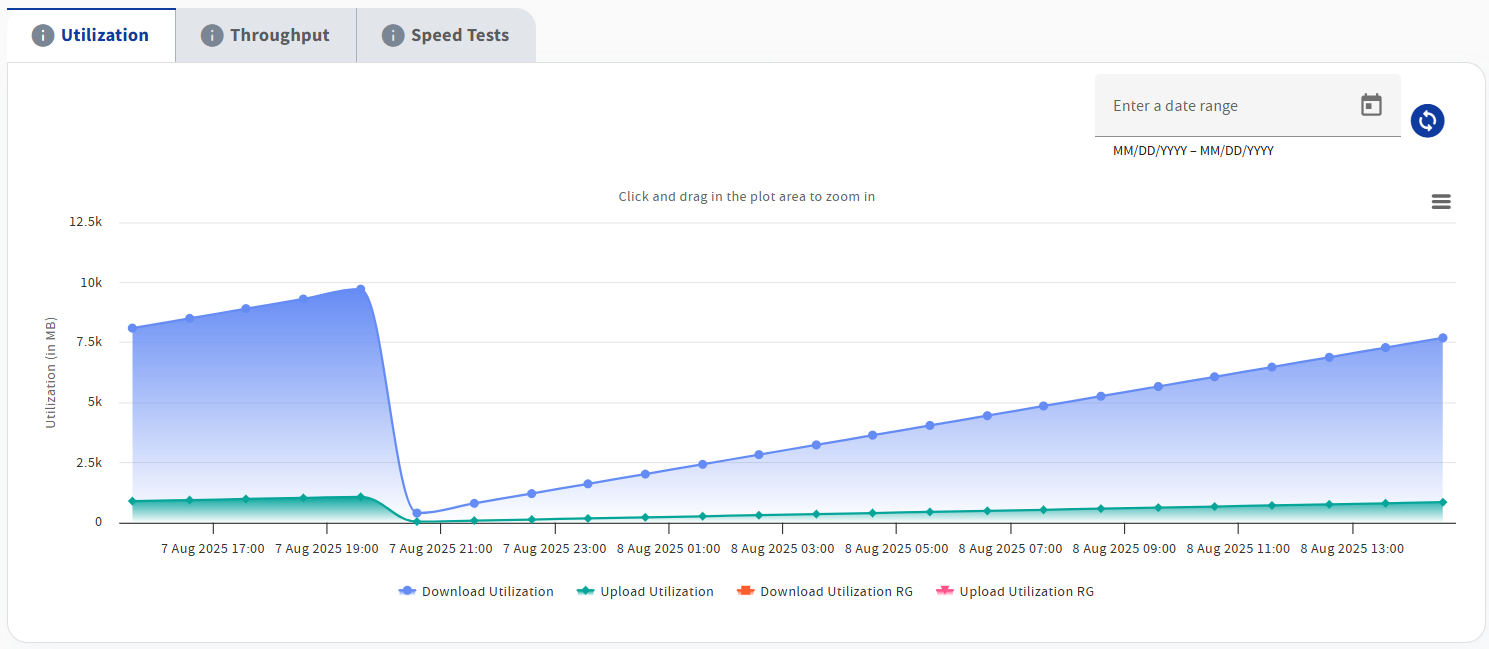
By default, the Utilization chart will show at the bottom of the Care Subscriber Details. This chart displays a time series chart of the previous 24 hours of the subscriber's usage, in Megabytes.
You can specialize the display to show only upload or only download usage by selecting the text label or colored dot in the legend below the chart.
-
Select Upload Utilization (or the green colored dot) to toggle the display of upload data on and off.
-
Select Download Utilization (or the blue colored dot) to toggle the display of download data on and off.
The datepicker in the top right corner of the graphs area may be used to select a specific time window in history. Time windows greater than 48 hours will show data in 1 hour intervals, while time windows smaller than 48 hours will show data in 5 minute intervals.
Throughput
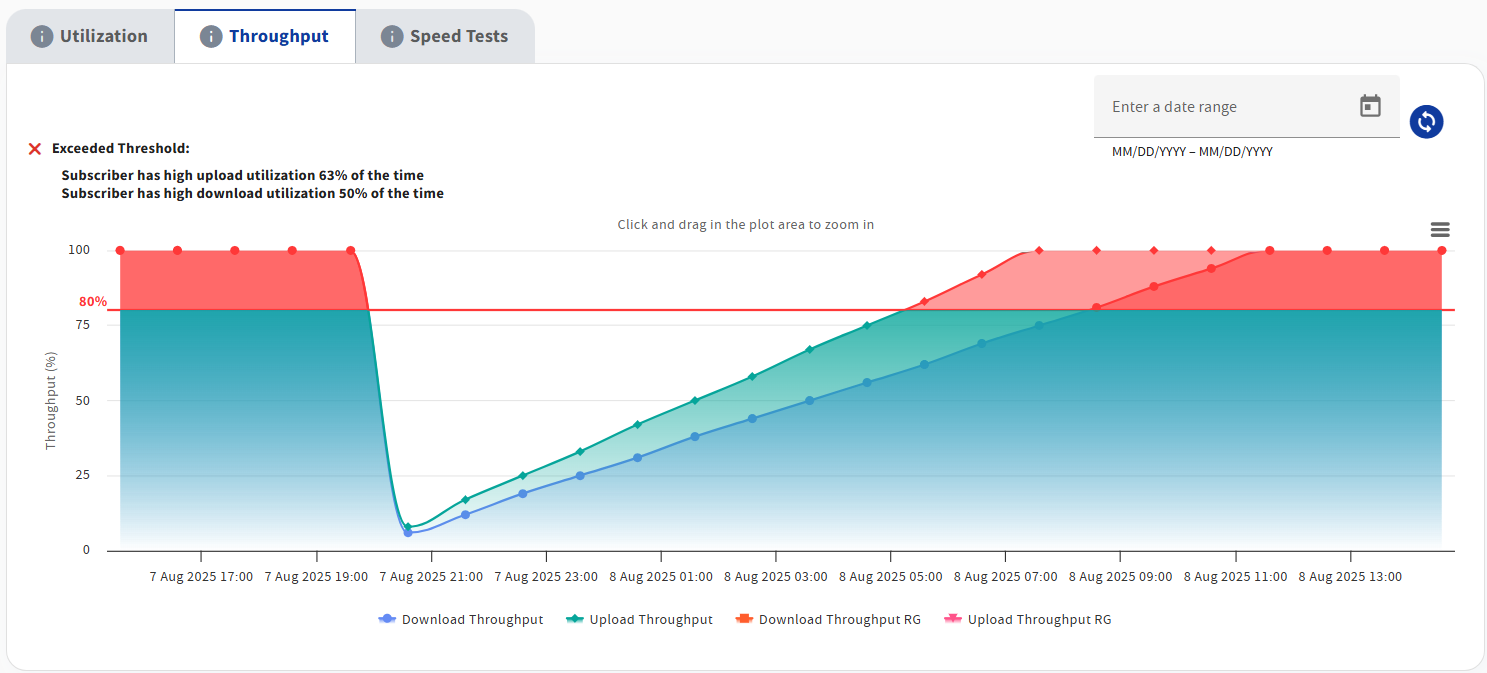
The Throughput chart can be viewed by clicking on the associated tab. This chart displays a time series chart of the previous 24 hours of the subscriber's percent throughput usage, with 100% being the subscriber's provisioned rate.
The red horizontal line is set at 80 % utilization. If either the upload or download curves exceed this threshold, the subscriber is likely to be experiencing a poor internet experience because consumption exceeds the provisioned rate.
WAN Saturation
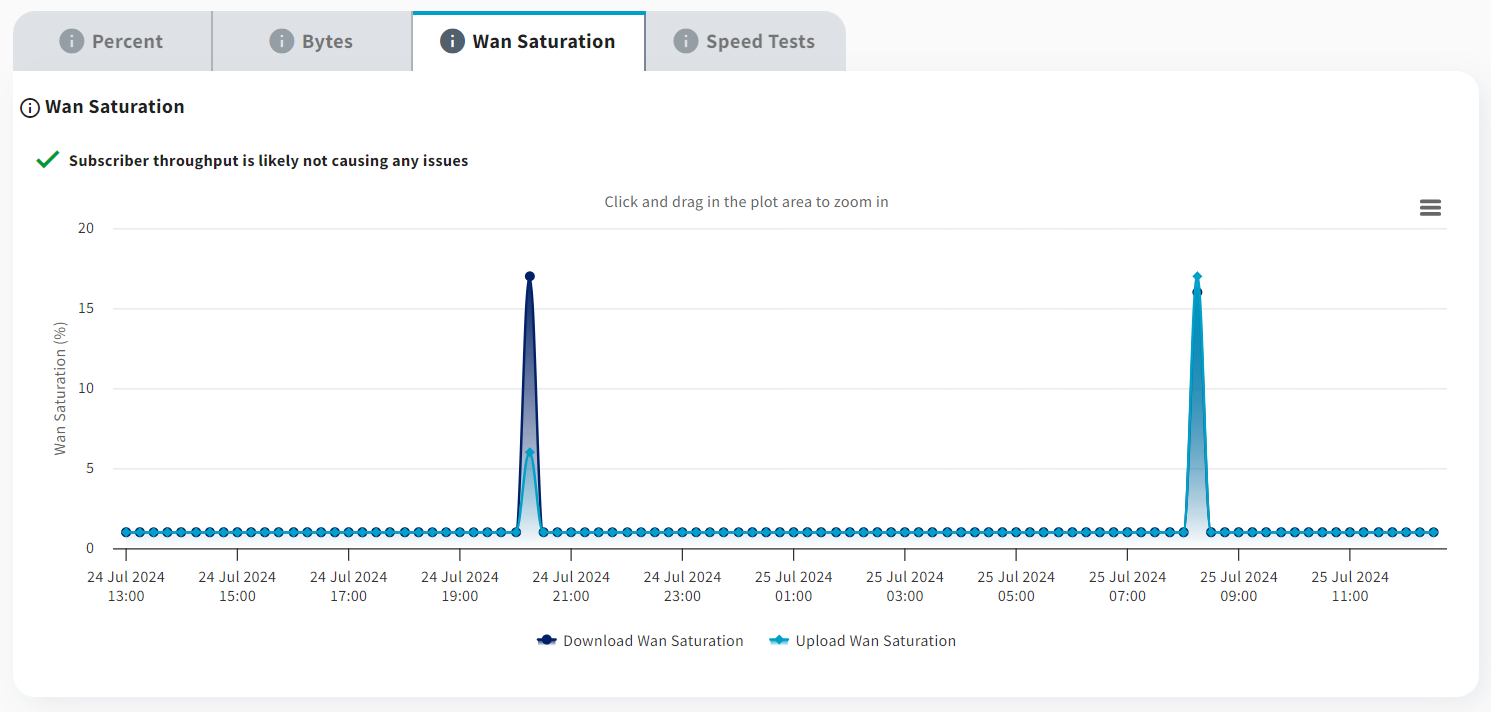
The WAN Saturation graph can be viewed by clicking on the associated tab. This graph gives an indiciation of how much bandwidth is being used by the router as a percentage of the latest speed test results. This graph is only present for Plume managed services.
Speed Tests
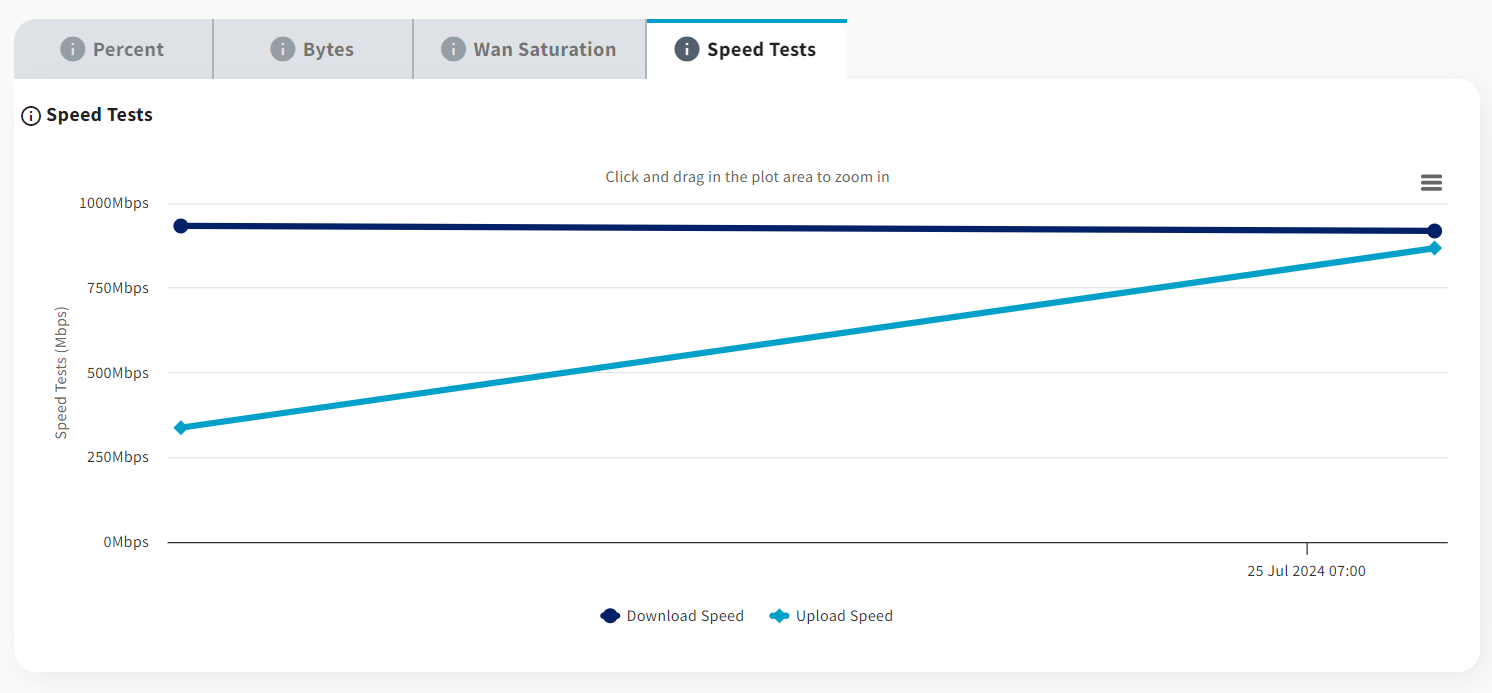
The Speed Tests graph can be viewed by clicking on the associated tab. This graph shows the speed test results over time for both upload and download. This graph is only present for Plume or Intellifi managed services.
Application Links
A series of buttons appear in the lower left that provide quick access to the various supporting applications from which Mosaic One gathers data. In general, if an application is not configured or doesn't apply to the particular subscriber, that button will not be shown.
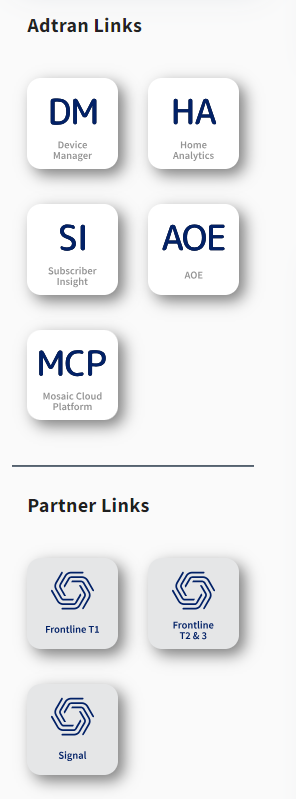
Below is a table with details on each application link.
| Application | Supports SSO | Supports Deep Link | Notes |
|---|---|---|---|
| Mosaic Cloud Platform | No | No | |
| Mosaic Device Manager | Yes | Yes | Deep link requires Device Manager Version 10.8.1.0 or later |
| Mosaic Home Analytics | Yes | No | |
| Mosaic Subscriber Insight | Yes | Yes | |
| Intellifi MeshView | Yes | Yes | |
| AOE | No | Yes | Deep link requires MSI to have ssh access to the AOE server. If an AOE deep link is expected, please contact support. |
| Plume Frontline T1 | No | Yes | |
| Plume Frontline T2 & 3 | No | Yes | |
| Plume Signal | No | No |